


Chirality is a chemical property that is very important to current pharmaceutical development processes. In the past, manufacturing processes for drugs ignored chirality, and whatever mixture of enantiomers was produced synthetically was used. However, the effects of the different enantiomers are often not equivalent. In some cases, they have very different physiological effects; sometimes, two enantiomers of the same compound can be used to treat separate medical conditions. For example, the (R,R) form of Ritalin is used to treat Attention Deficit Disorder while the (S,S) form is an antidepressant. Sometimes, the less active enantiomer is responsible for most of the side effects in the racemic drug version.
In some cases, where the beneficial medical effects come solely or primarily from one enantiomer, creating a single enantiomer version of the drug can provide effective treatment with fewer side effects (e.g., Lexapro is a single enantiomer version of the antidepressant Celexa). Cases like these have made the search for single enantiomer drugs an important area of pharmaceutical research [deBoer88].
Chirality can be studied using the vibrational optical activity (VOA) of molecules. VOA is the differential response to left vs. right circularly polarized infrared radiation (LCP vs. RCP) during a vibrational transition[Dukor00, Vargek97].
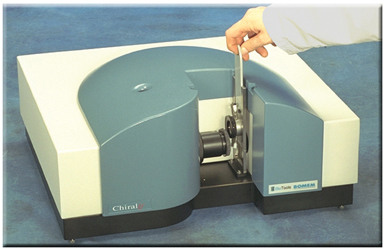
The ChiralIr™ VCD spectrometer from BioTools fits on a desktop (see www.btools.com). Since it requires neither calibration, nor any special spectroscopic skills to use, it allows VCD spectra to be measured as routinely as IR.
The IR form of VOA is known as vibrational circular dichroism (VCD). VCD can be used for many types of analysis related to the structure and conformations of molecules of biological interest:
- Determining the enantiomeric purity of a sample relative to a known standard.
- Determination of absolute configurations.
- Determination of the solution conformations of large and small biological molecules.
VCD has significant advantages over other methods for determining absolute configurations of molecules. For example, NMR shift reagent measurements require finding suitable chiral reagents (which shift some of the resonances for the two enantiomers in opposite directions), which can be difficult, and the technique is also problematic when the molecule contains multiple chiral centers.
Similarly, chiral chromatography works by physically separating the two enantiomers in a column; finding an appropriate chiral substrate can prove difficult and costly. Finally, X-ray diffraction requires a single crystal sample of the pure enantiomer.
In contrast to other techniques, VCD requires no foreign additive to the sample, nor any physical separation of the enantiomers. It is also relatively insensitive to temperature and to density changes arising from long path lengths (these changes are cancelled by corresponding changes within the parent IR spectrum).
Studying Chiral Molecules
In most cases, VCD studies consist of a combination of spectral measurement and electronic structure calculations. They also require a good IR spectrum of the sample. VCD spectra can be measured by a desktop instrument, and the required calculations can be performed on a high end PC or a UNIX workstation. The availability of Fourier Transform-based commercial instrumentation for VCD such as the ChiralIR from BioTools[Dukor00], and molecular orbital calculations of VCD spectra in Gaussian[Cheeseman96], have made VCD generally applicable and available, beyond the laboratories of pioneering VCD researchers.
The VCD spectrum of a chiral molecule is dependent on its three-dimensional structure: more specifically, its conformation and absolute configuration. Thus, VCD can allow you to determine the structure of a chiral molecule. Both the IR and VCD spectra of diasteriomers—e.g., (R,R) vs. (R,S)—differ; for enantiomers—(R,R) vs. (S,S)—the IR spectra are again identical, but the VCD spectra have opposite sign. The VCD results provided by electronic structure calculations can be used to identify the absolute configuration producing a given observed spectrum, and they can also elucidate the contributions of different conformations to a spectrum.
Electronic structure studies proceed by first locating conformations for the species of interest. Next, the IR and VCD spectra are computed for all relevant conformations. Finally, these predicted spectra are compared with the experimental spectrum. Currently, the best tradeoff between accuracy and computational cost involves using Density Functional Theory—specifically, a hybrid functional like B3LYP or B3PW91—with the 6-31G(d) basis set (as a minimum).
EXAMPLE: FLUOROKETONES
As a first example, we’ll look at the IR and VCD spectra for the fluoroketone compound below. The chiral centers are numbered in the diagram.
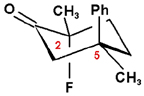
The IR and VCD spectra for the (R,R) and (R,S) enantiomers, the lowest energy conformer, are displayed in the right column of this page, along with a three-dimensional representation of each molecular structure.
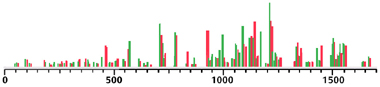
Although the IR spectra for the two diasteriomers look similar, they are different; the following plot displays the differing IR peaks, with the (R,S) peaks in green and the (R,R) peaks in red:
The IR spectra of of the (R,R) and (S,S) enantiomers are identical. However, the VCD spectra have opposite sign (see the illustration at the top of the next page). Thus, computed VCD spectra can easily distinguish enantiomers. Although predicted IR spectra can be used to identify diasteriomers, in practice the relevant diasteriomers are usually determined prior to VCD studies.
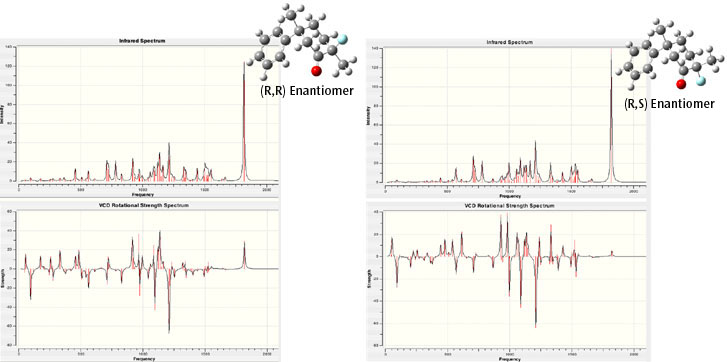
The predicted IR and VCD spectra for the (R,R) and (R,S) enantiomers. Although the IR spectra are similar, there are differences between them. The VCD spectra are clearly different. All spectra are truncated at 2100 cm-1 (there are additional peaks in the 3000-3300 range).
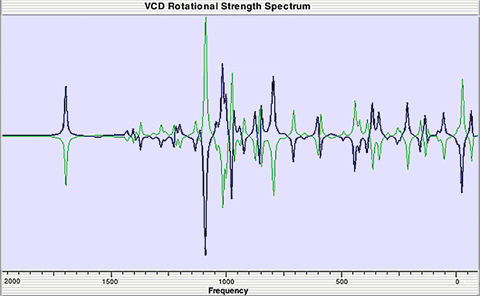
Predicted VCD spectra for the (R,R) and (S,S) enantiomers (blue and green, respectively).
The following plot compares the final predicted VCD spectrum for the (R,R) enantiomer, averaged over several conformers, to the observed spectrum. Comparing the two spectra, in terms of the sign and relative intensity for the majority of the bands, makes it clear that experimental spectrum corresponds to the (R,R) enantiomer [Freedman04].
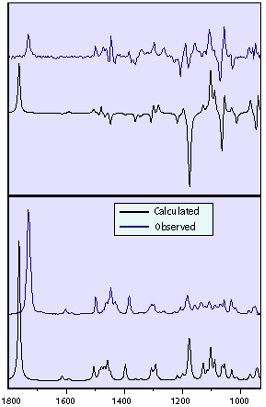
Comparison of the observed and calculated IR (bottom) and VCD (top) spectra for the (R,R) enantiomer.
Modeling Multiple Conformations
VCD can not only determine the absolute configuration, but (as an added bonus) can also determine solution conformation.
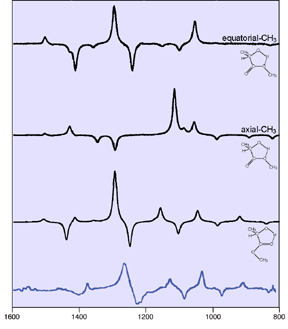
Here we examine the VCD spectra for three conformations of (+)-(R)-methyllactate. Internal hydrogen bonding within the ring can take place either to the C=O group or to the OCH3 group. The former is planar, while the latter is puckered and has two conformations corresponding to equatorial and axial placement of the methyl substituent.
The following diagram illustrates the predicted VCD spectra for the three conformations. When we compare them to the observed spectrum (in blue), it becomes evident that the conformer having internal hydrogen bonding to the O=C group dominates it [Stephens00].
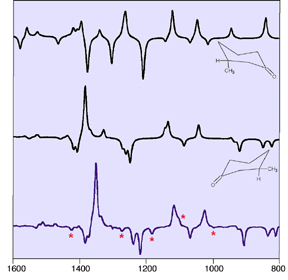
Sometimes, a VCD spectrum exhibits features from more than one conformation. Consider the diagram below. It displays the predicted VCD spectra for two conformations of the (+)-(R) enantiomer of 3-methylcyclohexanone.
In this case, comparing the calculated and experimental spectra indicates that the latter is dominated by the second conformation (the middle spectrum). However, some of its features are clearly attributable to the first conformation (upper spectrum), as indicated by the stars in the experimental spectrum.
As illustrated by the examples we’ve discussed, the combination of IR and VCD measurement and theoretical calculation enables the determination of solution-state stereochemical structural information in chiral molecules that, in some cases, is unavailable from any other method. This information includes absolute configuration and solution-state conformation for single-conformer molecules or principal conformational populations for multiple-conformation molecules. The inclusion of additional solvent modeling options, such as the polarizable continuum model (PCM) and ONIOM in Gaussian 03 will make possible new, more detailed studies of the effects of solvent environments on the conformations of chiral molecules and biomolecules in solution through the calculation of their IR and VCD spectra.

BioTools, Inc.
950 Rand Road, Unit 123
Wauconda, IL 60084 USA
Voice: 866-286-6571
Fax: 847-487-5544
Email: info@btools.com
www.btools.com
Last updated on: 21 June 2017.