


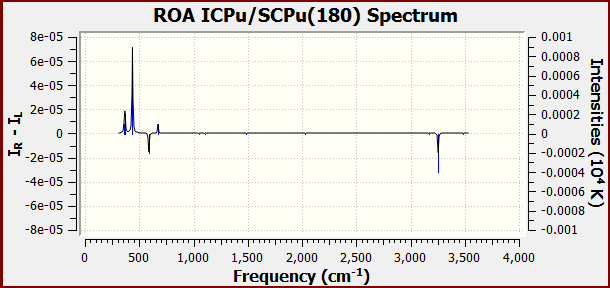
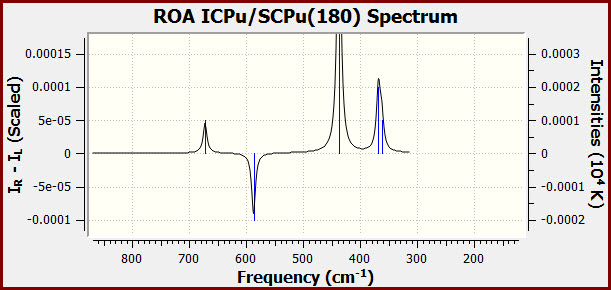
GaussView has the capability of displaying a variety of predicted spectra. Here is an example from an ROA calculation:
It is quite common to want to customize such plots. GaussView provides a variety of options for doing so. Most are reached from the plot context menu, accessed by right-clicking anywhere within the plot area:
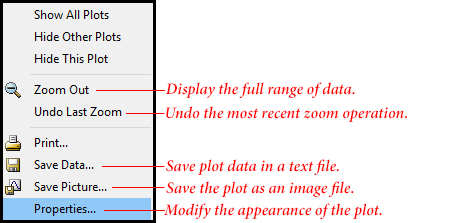
The various menu options are explained by the captions. Choose the Properties item in order to modify the chart units, scaling, and other characteristics. Doing so opens the following dialog:
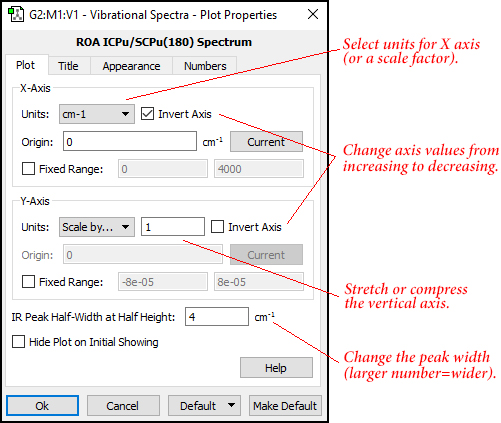
You can scale the Y-axis values, change the values from increasing to decreasing for either or both axes, change the units used for the X-axis (the other choices are GHz and THz) or specify a scale factor (which implies units of cm-1). Finally, you can narrow or broaden the widths of the peaks by decreasing or increasing the IR Peak Half-Width at Half Height value (respectively).
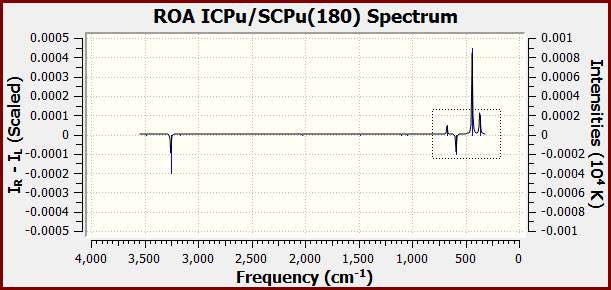
The following plot has had its X-axis reversed and the peak widths broadened (using a value of 6):
The preceding plot has also been zoomed to focus on just the range of data of interest. This is accomplished by dragging a rectangle around the desired data with the mouse. When you release the mouse button, the selected data range—both horizontal and vertical—with fill the plot window. For example, the following zoom operation produced the preceding plot:
You can print the plot at any point by selecting Print from the right-click menu. You can also save the current plot—as customized—as an image file, via the Export item on that menu. You can choose to save the image in a variety of file formats.
Sometimes, it is helpful to export the plot data into a text file for import into Excel or another program. This is accomplished via the Save Data option on the right-click menu. When the Save dialog opens, it contains some additional fields which allow you to specify the desired range of data to save:
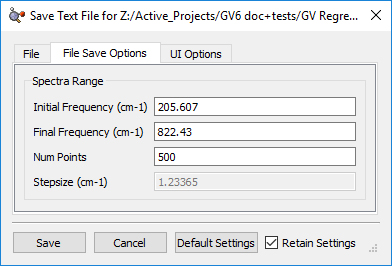
All values in the Range area are in cm-1. The Initial and Final fields specify the starting and ending point of the data you want to save, and the Stepsize field specifies the interval between data points. In this example, we want to have data from 200 to 830 cm-1, with a data point every 1.23365cm-1. Some programs effectively cut off the first and/or final data points, so starting one interval before the value you want and ending one interval after it will ensure that every point you want is included.
Last updated on: 21 June 2017.