GaussView 6 now allows you to view data from multiple sources as a combined plot. The customization options allow you to:
- Change the lines are represented: as lines, sticks, or a combination of the two.
- Specify line/stick characteristics, such as thickness and color.
- Plot a combination line and specify its appearance.
- Assign weights to the component data sets, including Boltzmann averaging.
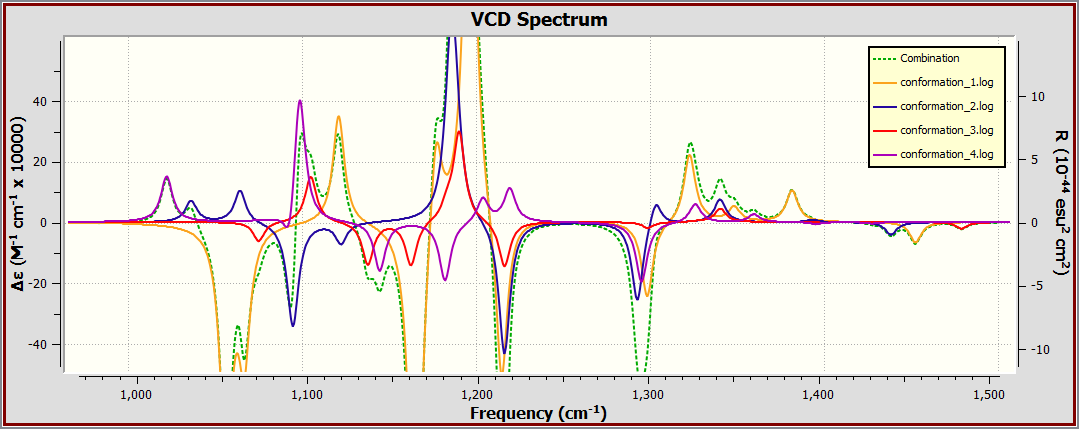
For example, the VCD plot below shows the individual spectra for the 4 conformations, along with the Botzmann-weighted spectrum (dashed green line). We can see the combination spectra is dominated by conformation 1.