GaussView 6 can display results for both harmonic and anharmonic frequency analysis for IR, Raman, VCD and ROA spectra. The predicted anharmonic peaks and intensities are reported along with the harmomic peaks and intensities. Overtone and combination bands are included.
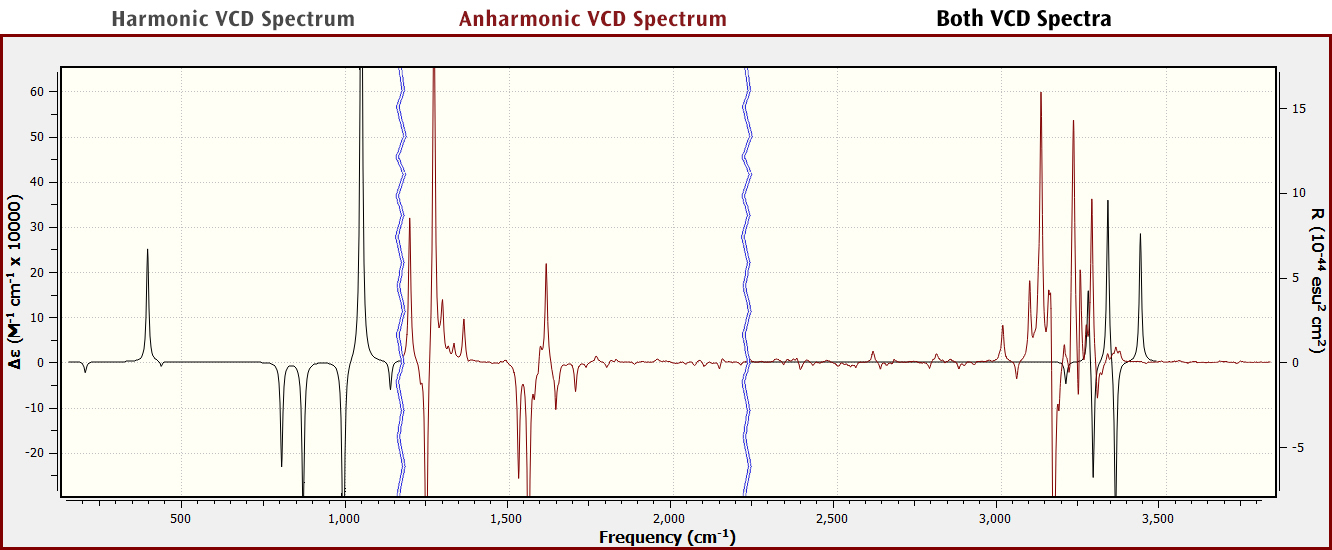
The spectra can also be viewed graphically, either separately or on the same plot. For example, below we see the harmonic VCD spectrum on the left side of the graph, the anharmonic VCD spectrum in the middle, and the combination of both spectra on the right.