Gaussian 16 can compute vibronically-resolved electronic spectroscopy for one photon absorption processes. In a vertical excitation resulting from the absorption of a photon, a molecule moves from its ground electronic state to an excited state. The geometry of the excited state immediately afterwards is not the equilibrium structure of the excited state, i.e., the minimum on the excited state potential energy surface. Rather, because the time scale in which electronic transitions occur is so small compared to nuclear motions, the nuclei are nearly unaffected, and the ground state equilibrium geometry is initially retained.
A consequence of the geometry of the excited state being initially unchanged from the ground state is that the vibtational state taken on by the molecule in its excited state need not be the lowest one. Rather, when the molecule transitions to the excited state, it moves to a vibrational state that is instantaneously compatible with its current one.
In reality, the actual energy transition observed in an experiment is a series of many energy transitions from the various vibrational levels of the ground state to the various vibrational levels of the excited state, with the strength of each individual transition depending on the population of that state and the overlap between the ground and excited vibrational wavefunctions for that transitions.
These effects are the basis of the Franck-Condon principle. Gaussian 09 introduced Franck-Condon and Herzberg-Teller analysis capabilities (as well as their combination), allowing these spectra to be predicted. Gaussian 16 significantly enhances these features, adding the ability to predict intensities, perform band assignment and providing other data about overlap between states.
Examples of the results of Gaussian 16’s vibronic analysis capabilities are shown below:

Duschinsky Matrix and Vibronic One Photon Absorption Spectrum for (S)-+-naproxen-OCD3
The Duschinsky matrix (left) is a visual depiction of vibrational mode overlaps between the corresponding modes in the ground state and the excited state. It is a good approximation of this data so long as no large distortion occurs during the transition. In these plots, modes for the initial state run along the X-axis, and those for the final state run down the Y-axis. each cell is filled with a tone representing the percentage overlap of the two modes. For example, 25% overlap is depicted as a 25% fill while 100% overlap is depicted by a solid color. In this case, non-zero overlap is mostly confined to a diagonal band running from the upper left to the bottom right of the graph. Significant differences between many modes in the two states are clear from this plot.
The plot on the right shows the predicted vibronic spectrum for the same compound. The blue line is the overall spectrum, and the red line is the spectrum corresponding to the transitions requested in the calculation; the latter are represented by the vertical green lines which we have labeled with their specific transition. Transitions can be computed for only a portion of the total spectrum if desired. Note that the X-axis indicates the energy relative to the 0-0 transition
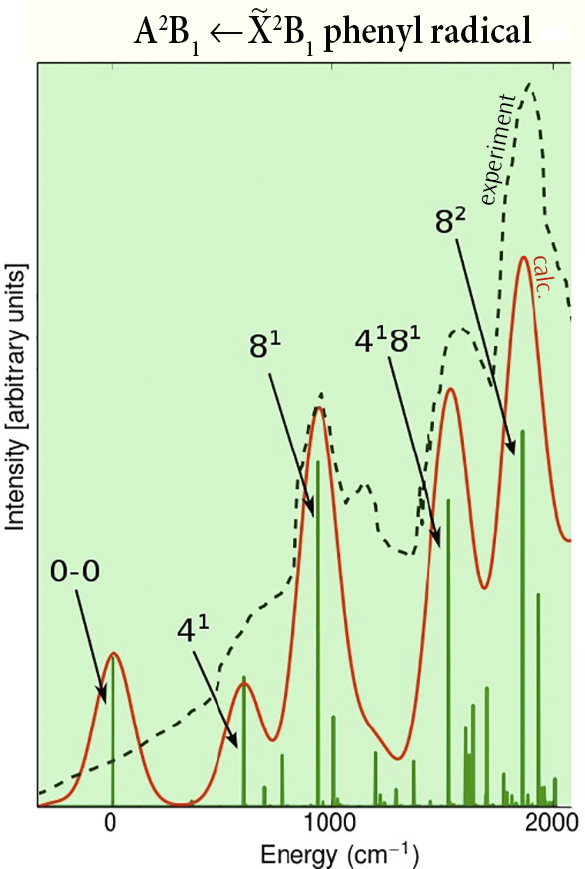
Phenyl Radical Vibronic OPA Spectrum
This plot shows the vibronic spectrum and intensities of the strongest transitions in the region ending 2000 cm-1 above the 0-0 transition. The transitions are plotted as green vertical lines (labels identify the specific transition). The predicted spectrum is plotted in red. It compares very well to the observed spectrum (black dashed line) [J.G. Radziszewski, Chem. Phys. Lett 301 (1999) 565].