Gaussian 16 can predict Resonance Raman (RR) spectra. RR Spectroscopy is a type of Raman spectroscopy where the incident laser frequency is close in energy to an electronic transition of the compound being studied. This has the advantage of enhancing the intensity of the scattered light.
These experiments typically scan over a range of frequencies for the incident light. The resulting data can be plotted as a three dimensional surface: the incident light frequencies and the corresponding observed peaks are plotted in the X-Y plane, with the intensity determining the height of the curve above the plane.
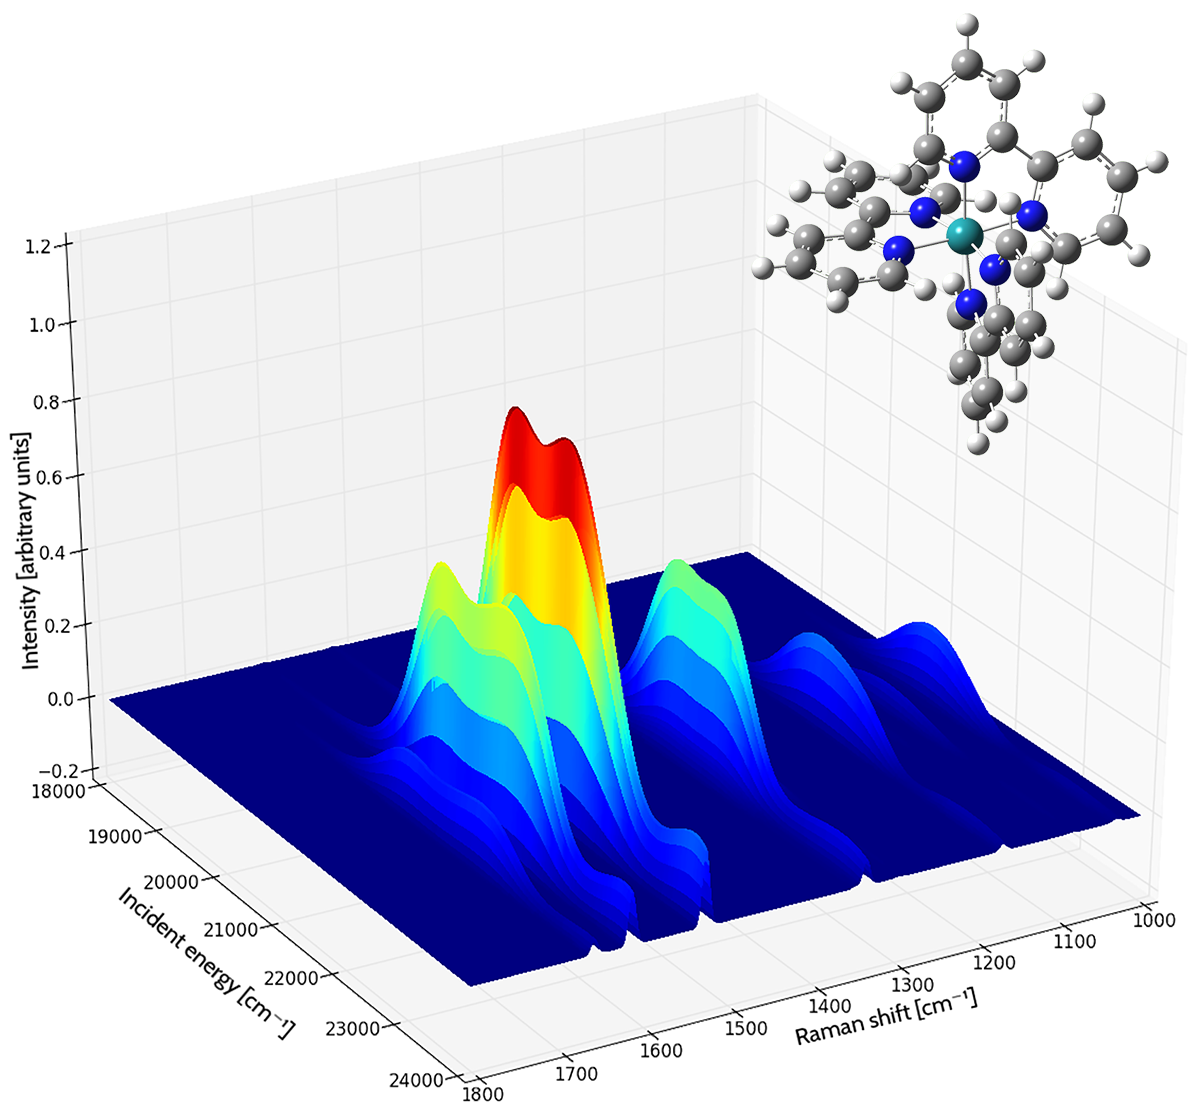
Resonance Raman spectrum of the tris (2,2′-bipyridyl)-ruthenium(II) Complex
Each curve shows the intensity of the Raman shift produced by various frequencies of incident light. The area under each curve is filled, colored by the magnitude of the intensity (blue to red as the intensity increases). The spectrum was computed in acetonitrile solution.