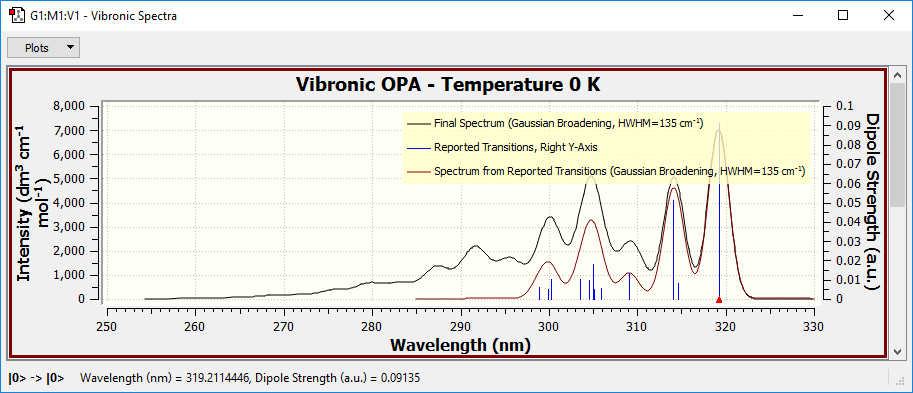
GaussView 6 can now display the results of vibronic analysis, including vibronic spectra and Duschinky matrices. For example, the figure below shows the vibronic one-photo absorption spectrum results. The reported transitions (blue sticks), the spectrum corresponding to the reported transitions (red curve) and the final spectrum (black curve) can be all viewed the plot below.
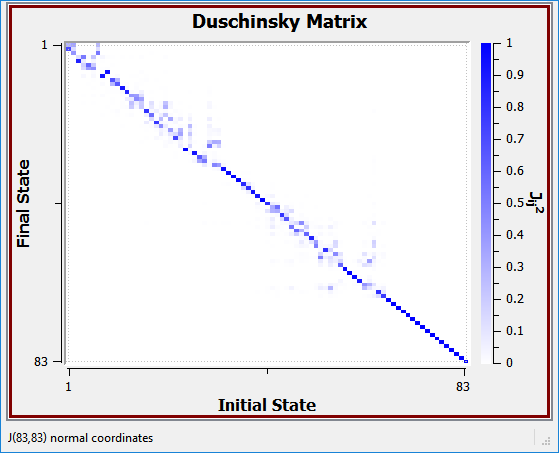
The Duschinsky Matrix display below shows the overlap between each pair of initial and final states as a shade on the color tone scale from white (0% overlap) to solid color (100% overlap). For example, we can see a region of 40-60% overlap between the initial and final states numbered near 40.