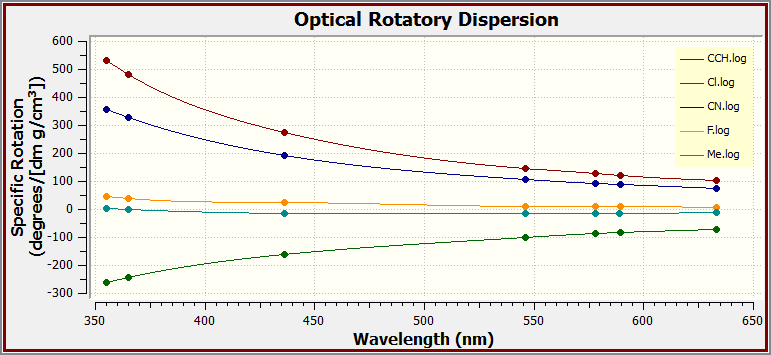
GaussView 6 can now plot the results of an Optical Rotary Displacement calculation. The ORD results for every molecule in a molecule group can be displayed in a single plot. The figure below plots the ORD result for each specified incident frequency for a series of five molecules. Each point represents the predicted rotation at the specific wavelength.